SVM (Support Vector Machine)


It is a classification method. In this algorithm, we plot each data item as a point in n-dimensional space (where n is number of features you have) with the value of each feature being the value of a particular coordinate.

For example, if we only had two features like Height and Hair length of an individual, we’d first plot these two variables in two dimensional space where each point has two co-ordinates (these co-ordinates are known as Support Vectors)


Now, we will find some line that splits the data between the two differently classified groups of data. This will be the line such that the distances from the closest point in each of the two groups will be farthest away.
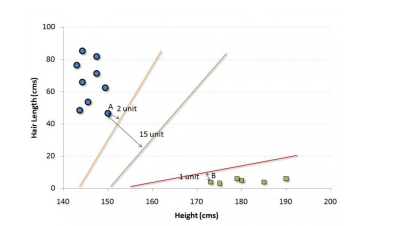
In the example shown above, the line which splits the data into two differently classified groups is the black line, since the two closest points are the farthest apart from the line. This line is our classifier. Then, depending on where the testing data lands on either side of the line, that’s what class we can classify the new data as.

Example in Python for Support Vector Machine

import matplotlib.pyplot as plt
import numpy as np
from sklearn import datasets, linear_model, metrics

# load the boston dataset
boston = datasets.load_boston(return_X_y=False)
 
# defining feature matrix(X) and response vector(y)
X = boston.data
y = boston.target
 
# splitting X and y into training and testing sets
from sklearn.model_selection import train_test_split
X_train, X_test, y_train, y_test = train_test_split(X, y, test_size=0.4,
                                                    random_state=1)

# create Support Vector Machine object
svc = svm.SVC(Kernel='Linear')

# train the model using the training sets
svc.fit(X_train, y_train)

# variance score: 1 means perfect prediction
print('Variance score: {}'.format(svc.score(X_test, y_test)))